Table 2.

Summary of Simultaneous Regression Analysis for Variables Predicting Acceptability of the Frequency of Sexual Activity


Variable                                                           B                      SE B                    ß


Frequency of Sex                                             .155                 .005                 .561*


Sexual Orientation                                            1.146               .148                 .092*


Gender                                                             1.36                 .071                 .205*


Age                                                                  .017                 .003                 .060*


Relationship Status                                            .442                 .038                 .110*


Length of Relationship                                      -.007                .004                 -.020


Education                                                         .070                 .010                 .061*


Orientation*Gender                                          -1.055              .242                 -.054*


Gender*Freq. of Sex                                        -.044                .005                 -.135*


Orientation*Freq. of Sex                                  -.122                .007                 -.196*


Orientation*Gender*                                        .084                 .014                 .068*

Freq. of Sex


Note: R²=.236; *p<.05; **p<.001


Table 3.

Analysis of Variance for Acceptability of the Frequency of Sexual Activity


Comparison                                df                        F                    Std. Error                 p


Hetero Men vs.                        11885              66.288                 .005                      .000

Hetero Women


Hetero Men vs.                        11885              243.957               .007                     .000

Gay Men


Hetero Men vs.                        11885              30.999                 .013                     .000

Gay Women


Hetero Women vs.                   11885              116.117               .006                     .000

Gay Men


Hetero Women vs.                   11885              4.918                   .012                     .027

Gay Women


Gay Men vs.                             11885              9.474                   .013                     .002

Gay Women


Table 4.

Summary of Simultaneous Regression Analysis for Variables Predicting Acceptability of the Frequency of Sexual Activity


Variable                                                           B                      SE B                    ß


Acceptability of Verbal                                    .423                 .009                 .418**

Affection (VA)


Frequency of VA                                              -.001                .000                 -.019


Frequency of Sex                                             .085                 .002                 .308**


Sexual Orientation                                            -.106                .168                 -.008


Gender                                                             .984                 .064                 .148**


Age                                                                  .014                 .003                 .051**


Relationship Status                                            .377                 .035                 .094**


Length of Relationship                                      .009                 .003                 .027


Education                                                         .031                 .009                 .027**


Orientation*Gender                                          -.504                .286                 -.026


Gender*Accept. Of VA                                   .000                 .000                 .004


Orientation*Accept. of VA                               .004                 .001                 .039*


Orientation*Gender*                                        -.002                .002                 -.016

Accept. of VA


Note: R²=.375; *p<.05; **p<.001


Table 5.

Analysis of Variance for Acceptability of the Frequency of Sexual Activity


Comparison                                df                        F                    Std. Error                 p


Hetero Men vs.                        11884              84.237                 .016                      .000

Hetero Women


Hetero Men vs.                        11884              .964                     .038                     .326

Gay Men


Hetero Men vs.                        11884              .691                     .053                     .406

Gay Women


Hetero Women vs.                   11884              9.182                   .037                     .002

Gay Men


Hetero Women vs.                   11884              3.934                   .052                     .047

Gay Women


Gay Men vs.                             11884              .013                     .062                     .909

Gay Women


Table 6.

Summary of Simultaneous Regression Analysis for Variables Predicting Acceptability of the Frequency of Sexual Activity


Variable                                                           B                      SE B                    ß


Acceptability of Physical                                   .247                 .006                 .242**

Affection (PA)


Frequency of VPA                                           .000                 .000                 .001


Frequency of Sex                                             .034                 .001                 .122**


Sexual Orientation                                            -4.171              .155                 -.333**


Gender                                                             -4.451              .054                 -.671**


Age                                                                  .010                 .002                 .036**


Relationship Status                                            .138                 .022                 .034**


Length of Relationship                                        -.004                .002                 -.012


Education                                                         -.004                .005                 -.004


Orientation*Gender                                          4.109               .280                 .210**


Gender*Accept. Of PA                                    .819                 .007                 1.034**


Orientation*Accept. of PA                               .751                 .022                 .427**


Orientation*Gender*                                        -.773                .039                 -.289**

Accept. of PA


Note: R²=.749; *p<.05; **p<.001


Table 7.

Analysis of Variance for Acceptability of the Frequency of Sexual Activity


Comparison                                df                        F                    Std. Error                 p


Hetero Men vs.                        11884              63.252                 .016                      .000

Hetero Women


Hetero Men vs.                        11884              .508                     .037                     .476

Gay Men


Hetero Men vs.                        11884              .580                     .041                     .446

Gay Women


Hetero Women vs.                   11884              7.657                   .036                     .006

Gay Men


Hetero Women vs.                   11884              2.563                   .054                     .109

Gay Women


Gay Women vs.                        11884              .054                     .063                     .819

Gay Men


Table 8.

Summary of Simultaneous Regression Analysis for Variables Predicting Acceptability of the Frequency of Inappropriate Behavior with the Opposite/Same Sex


Variable                                                           B                      SE B                    ß


Frequency of Inappropriate                               -.063                .002                 -.248**

Behavior (IB)                                                  


Sexual Orientation                                            -.592                .147                 -.058**


Gender                                                             -.293                .055                 -.054**


Age                                                                  .010                 .003                 .046**


Relationship Status                                            -.278                .033                 -.085**


Length of Relationship                                      -.002                .003                 -.006


Education                                                         .098                 .008                 .105**


Orientation*Gender                                          .419                 .249                 .026


Gender*Freq. of IB                                          .003                 .000                 .094**            


Orientation*Freq. of IB                                    .003                 .001                 .032*


Orientation*Gender*                                        -.003                .002                 -.028   

Freq. of IB


Note: R²=.097; *p<.05; **p<.001


Table 9.

Analysis of Variance for Acceptability of the Frequency of Inappropriate Behavior with the Opposite/Same Sex


Comparison                                df                        F                    Std. Error                 p


Hetero Men vs.                        11862              6.471                   .005                      .011

Hetero Women


Hetero Men vs.                        11862              16.855                 .007                     .000

Gay Men


Hetero Men vs.                        11862              53.298                 .053                     .000

Gay Women


Hetero Women vs.                   11862              40.990                 .007                     .000

Gay Men


Hetero Women vs.                   11862              49.977                 .053                     .000

Gay Women


Gay Women vs.                        11862              61.344                 .053                     .000

Gay Men


 Table 10.

Summary of Simultaneous Regression Analysis for Variables Predicting Overall Relationship Satisfaction


Variable                                                           B                      SE B                    ß


Frequency of Inappropriate                               -.009                .003                 -.054**

Behavior (IB)                                                  


Sexual Orientation                                            .067                 .081                 .010    


Gender                                                             -.026                .035                 -.007   


Age                                                                  -.011                .002                 -.071**


Relationship Status                                            .179                 .023                 .082**


Length of Relationship                                      -.014                .002                 -.081**


Education                                                         .067                 .006                 .106**


Orientation*Gender                                          .245                 .127                 .023


Gender*Freq. of IB                                          -.004                .003                 -.016


Orientation*Freq. of IB                                    .007                 .005                 .016


Orientation*Gender*                                        -.129                .037                 -.033**

Freq. of IB


Note: R²=.049; *p<.05; **p<.001


 Table 11.

Analysis of Variance for Overall Relationship Satisfaction


Comparison                                df                        F                    Std. Error                 p


Hetero Men vs.                        11760              1.127                   .003                      .288

Hetero Women


Hetero Men vs.                        11760              2.017                   .005                     .156

Gay Men


Hetero Men vs.                        11760              11.944                 .036                     .001

Gay Women


Hetero Women vs.                   11760              5.534                   .005                     .019

Gay Men


Hetero Women vs.                   11760              11.292                 .036                     .001

Gay Women


Gay Women vs.                        11760              13.223                 .037                     .000

Gay Men


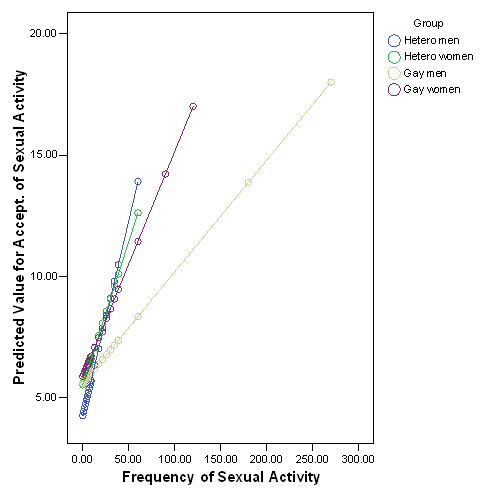
Plot 1.

Strength of Regression Coefficients between Frequency and Acceptability of Sex


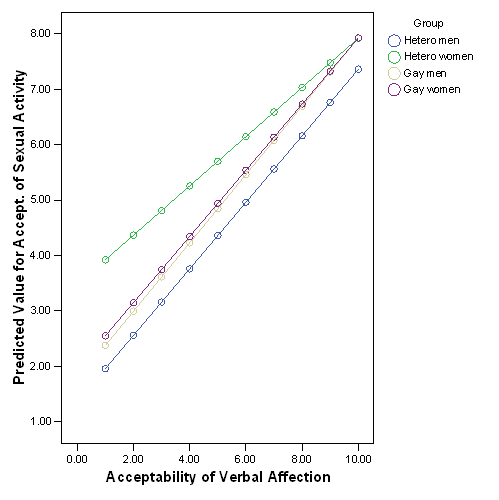
Plot 2.

Strength of Regression Coefficients between Acceptability of Sexual Activity and Acceptability of Verbal Affection


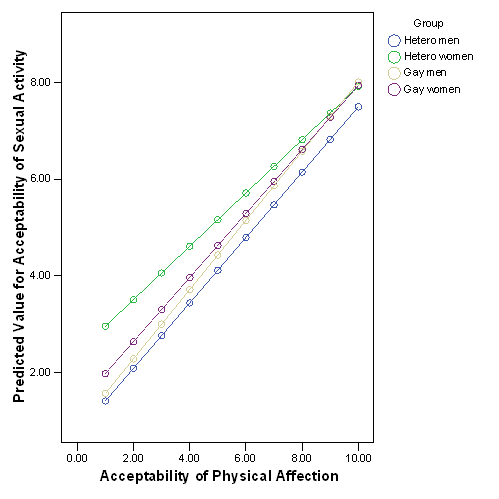
Plot 3.

Strength of Regression Coefficients between Acceptability of Physical Affection and Acceptability of Sexual Activity


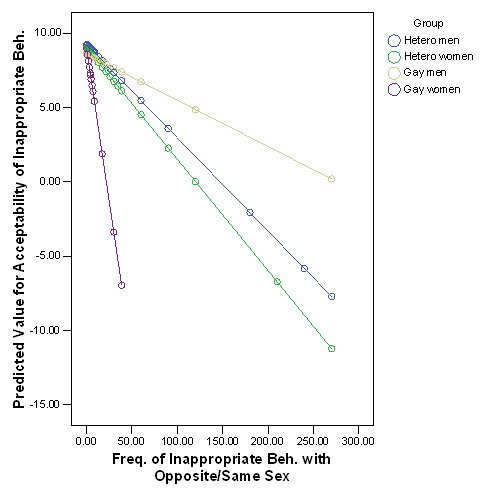
Plot 4.

Strength of Regression Coefficients between Frequency and Acceptability of Inappropriate Behavior


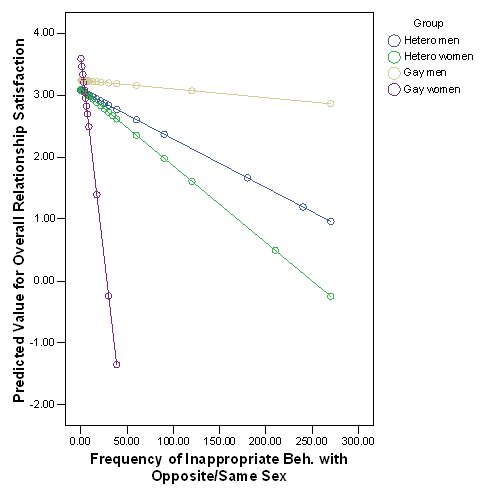
 Plot 5.

Strength of Regression Coefficients between Frequency of Inappropriate Behavior and Overall Relationship Satisfaction
 

Return to SSSSWR program

Return to Front Page